
3 Easy RMarkdown Customization Tools
Learn some quick techniques to optimize your knitted Rmarkdown layout!
If you’ve ever taken a data science course or worked as a data science intern, you have probably been asked to generate a statistical report at some point. While there are several methods to choose from, it’s likely that you’ve explored using a Markdown Editor, a lightweight text-to-HTML conversion tool. While IDEs such as RStudio typically provide simple tutorials for how to set up a markdown, there are a variety of other customization tools available in order to make your report look more professional (and potentially easier on the eyes!).
Here are 3 simple customizations that are sure to elevate your report’s appearance and impress your boss!
Note: This tutorial will be utilizing the RStudio IDE and is best suited for those with previous RMarkdown experience. If you need an introduction (or a refresher) to the basics of RMarkdown syntax, check out this link and explore sections 2.5 and 2.6
1. Hiding Your Setup
If you are generating a report that contains the findings gathered from external sources, such as a .csv, .txt, etc., chances are your audience doesn’t care to know how you sourced that data into your IDE. It may even pose a security issue to have sourcing information for your data available on a published or otherwise public report. Luckily, with RStudio, you have complete control over which code chunks you want to be included in your final report and which chunks you want excluded – and it’s pretty simple.
In the options portion of your R chunk (denoted by a series of three backtics), simply include {r setup, include = FALSE}. The setup argument tells RMarkdown to run that chunk first, even if it isn’t first in the markdown, while the include = FALSE argument insures that the chunk will not be knitted in your final output, whether it be .html, .pdf, .doc, etc.
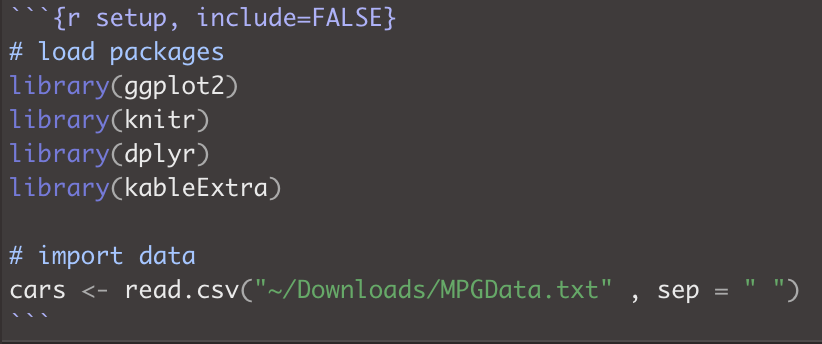
Any sort of data manipulation or set-up features that aren’t necessary for the comprehension of your report are best off going in this chunk. This way, you can refer back to it in the raw file of the report, but the knitted version won’t contain any unnecessary or potentially sensitive information.
2. Folding Code Chunks
While your report may not have sensitive information, you still might want to make your report a bit more cohesive without your readers having to scroll through lines of raw code. While you could use the above code from earlier, you may want to still provide readers with the option to see what code you used to create visualizations or complicated calculations. This can be done by folding your code chunks, which will hide your code by default unless a reader specifically requests to view the syntax.
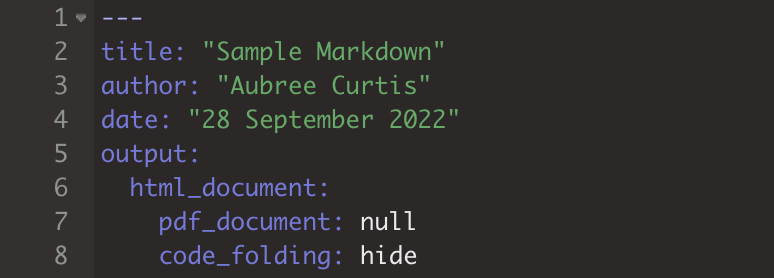
Markdown files traditionally contain a YAML header that specify how to format and style the outputted file. This is where you will include information such as the title of the report, author, and what file extension to append to the report (.html, .pdf, etc.).
When specifying output as an html document, simply add an additional line stating code_folding: hide to default all code to a hidden state when rendering the document.
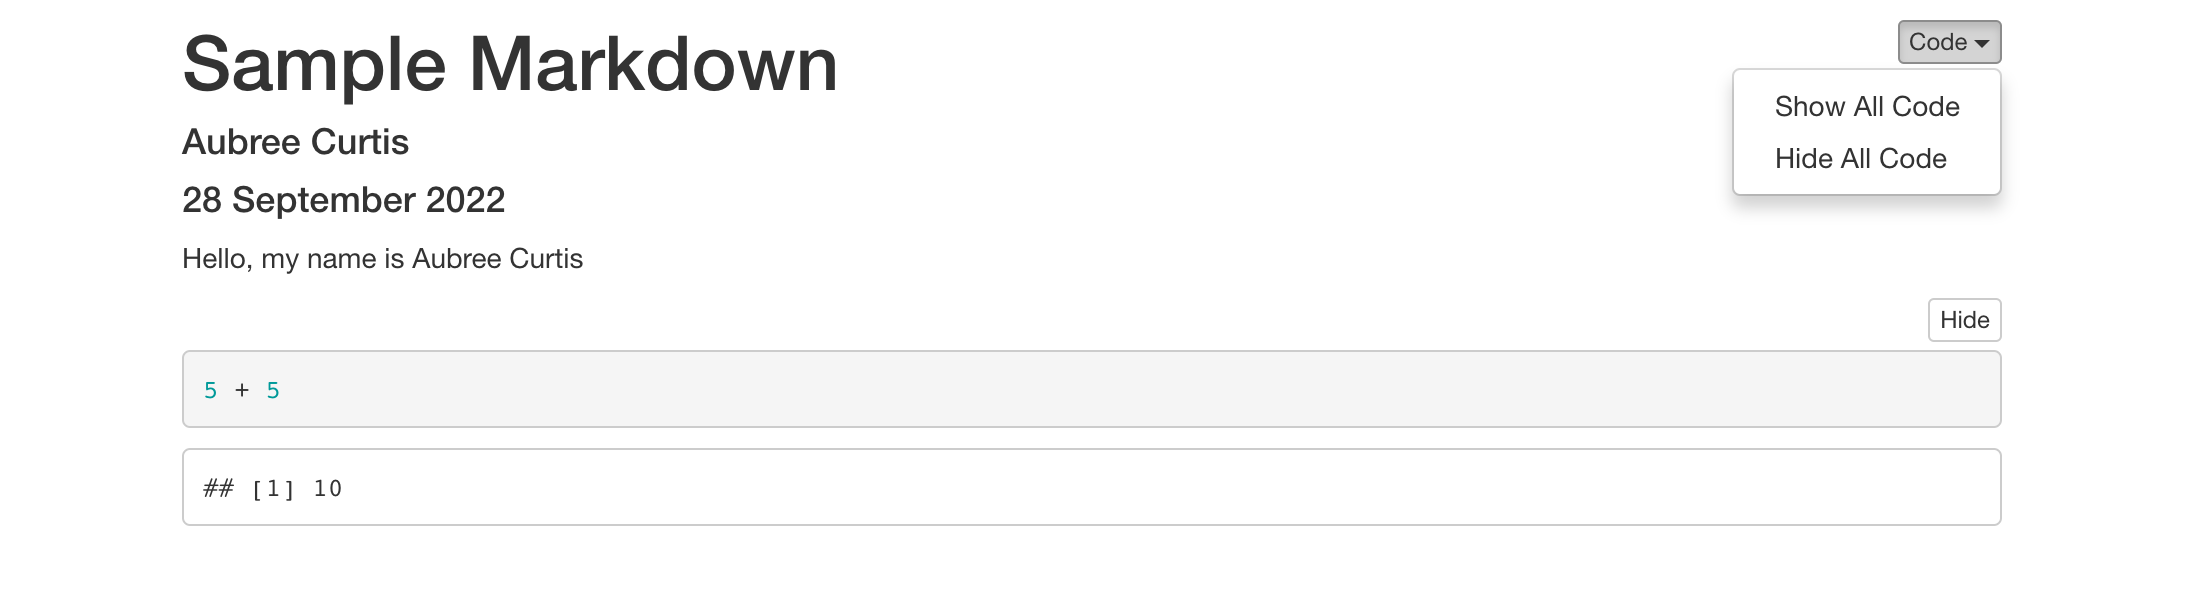
The resulting output when knitting the file will have a button in the top right corner where you can choose to hide or show code throughout the report.
3. Suppressing Messages & Positioning Plots
Have you ever tried displaying data in a report, only for it to either be 1) way too large (or small, or off-centered), or 2) displaying messages that are irrelevant to your findings? Thankfully, Markdown has some pretty simple customizable features that solve this problem.
The main arguments that you will want to implement on a regular basis in your options chunks are warning = FALSE and message = FALSE. Many languages such as R have built-in dialogue to inform you of potential data integrity issues, such as picking better binwidths for graphs, or points being excluded in a visualization range. However, even if you have your code chunks set to fold upon knitting, these warnings won’t be suppressed when you knit them to your final report unless you explicitly remove them.
Markdown also allows you to specify the size and placement of your plots when they output. These changes won’t be reflected when viewing them in the raw file format, but they are implemented in the same place as everything else – within your options chunk.
Specify plot width and height using out.width = "XX%" and out.height = "XX%". This will allow you to fit your plot based on the width of the report, so experiment with the sizing to see what looks best in y our final output. I like to go with a good old 75% for both height and width so it doesn’t feel like it’s invading my report, but find what size works best for you! And of course, if you want to make sure your plot is centered, simply add fig.align = 'center'
If you found these tricks to be helpful, I encourage checking out the official RStudio Blog! Among several topics ranging from data analytics to package development is a series focused specifically on providing lesser-known Markdown tips and tricks. Here is the first article of their 4-part series!
Stay tuned for more data science tips, tricks, and techniques!